TILE Analytics: Overview

Follow the instructions below to learn how to access TILE Analytics. Then select each Report tab to learn how to use the associated report.
Watch this video to see how to access and use TILE Analytics. You can also refer to the Step-by-Step instructions below.
Step-by-Step Instructions
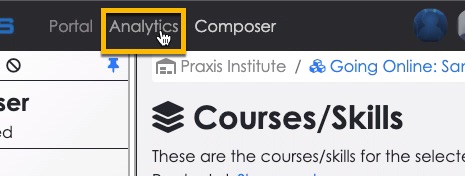
Access TILE Analytics- (If you’re not already there, access your admin profile in the sandbox.) Select the Analytics option at the top of the screen.
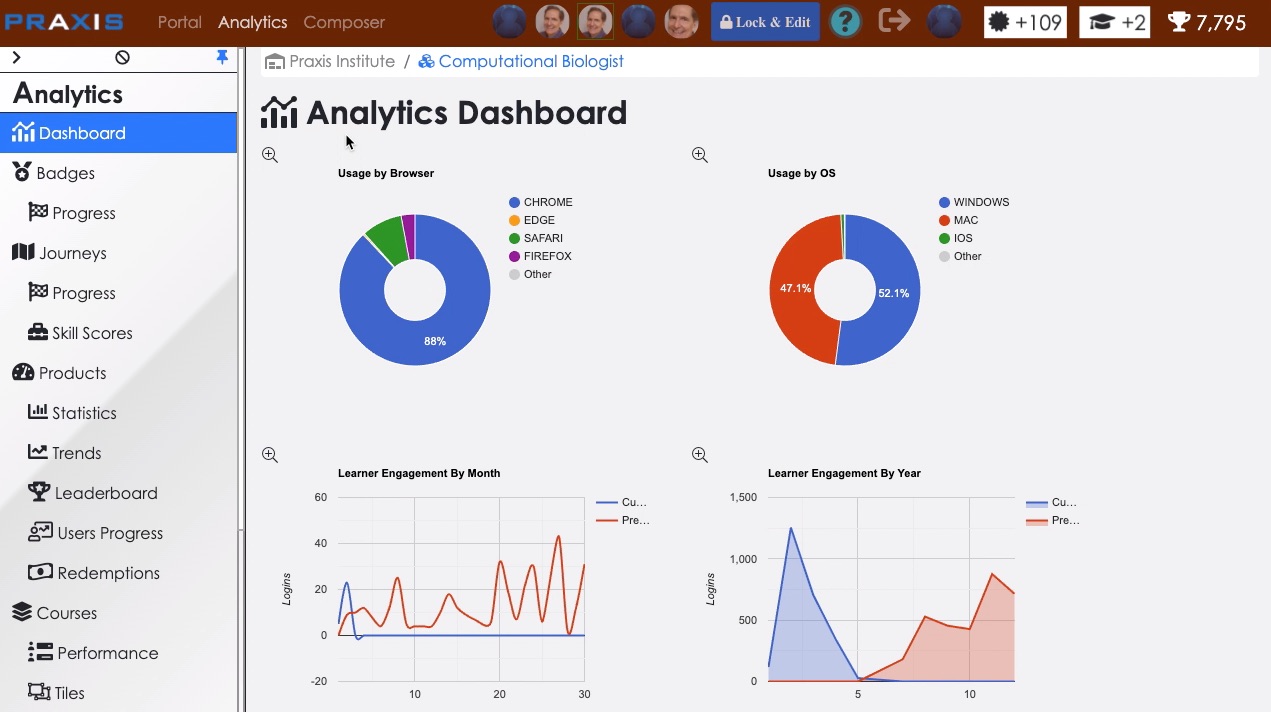
- The TILE Analytics tool loads, displaying the ‘Analytics Dashboard’ report by default.
Description
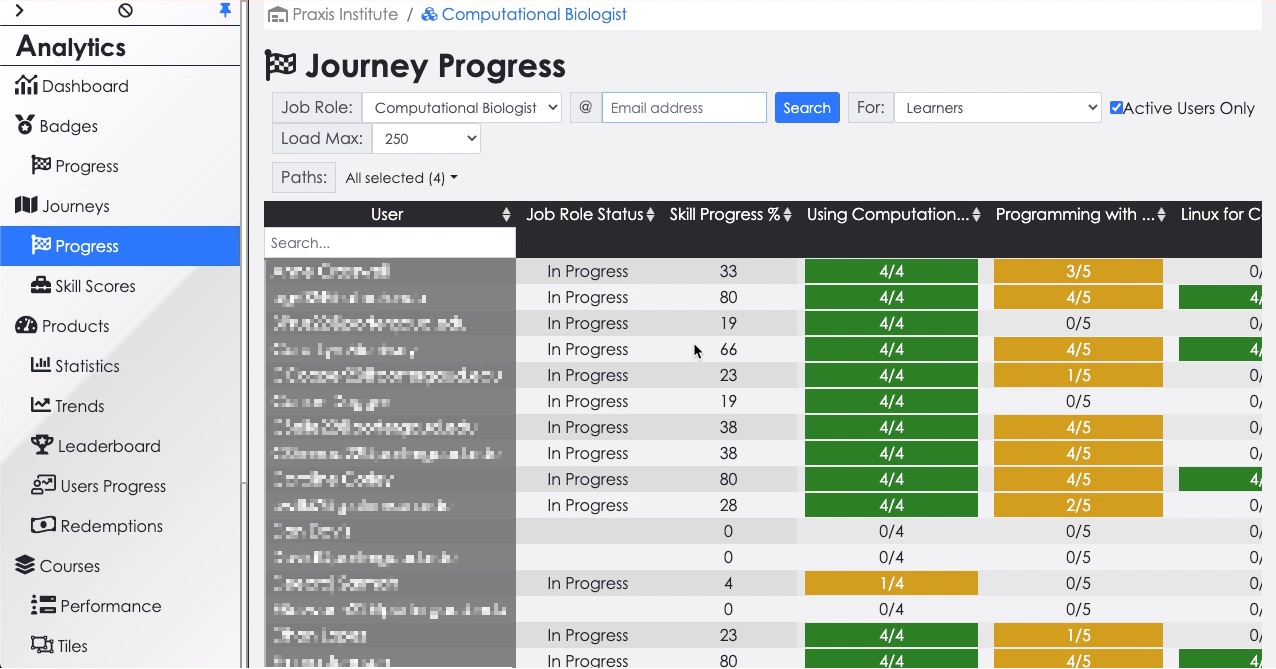
The Journey Progress report displays the current progress of all learners in the skills (lessons) of the course, using a “heat map” format. This report is especially useful because the color-coded display makes it easy to get an “at-a-glance” look at overall learner progress, while also providing good detail for each learner. It shows how many of the skills in your course (“learning journey”) each learner has completed, organized by learning path.
Skill CompletionFor each learning path, you can see the number of skills each learner has completed (e.g., 3/4 means that learner has completed 3 out of 4 skills). This report is one of the best ways to quickly tell if any of your learners are falling behind.
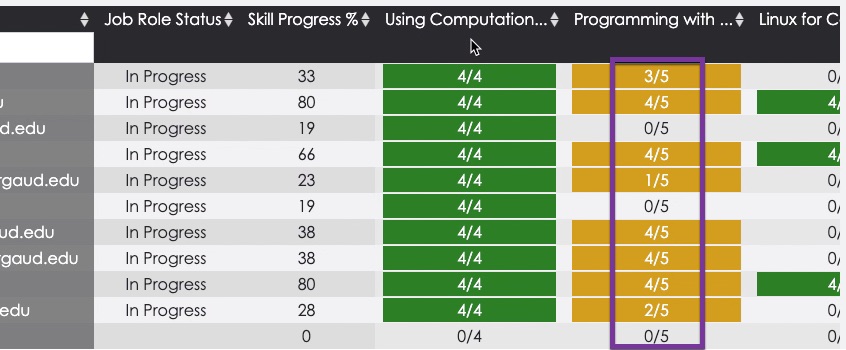
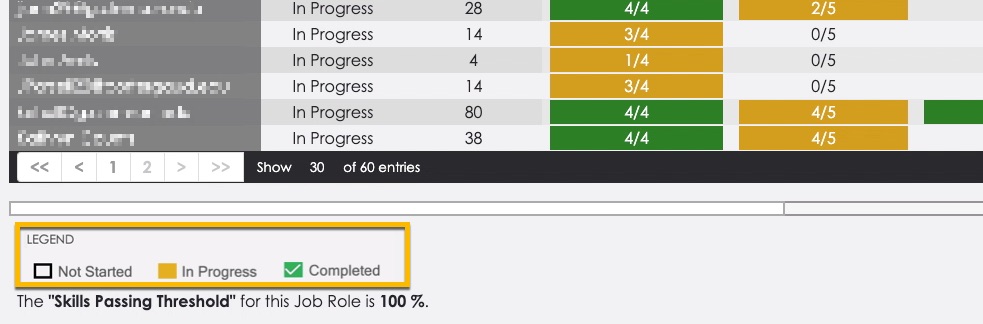
Each color in the report has a specific meaning: Green=completed, Yellow=in progress, Clear=not started.
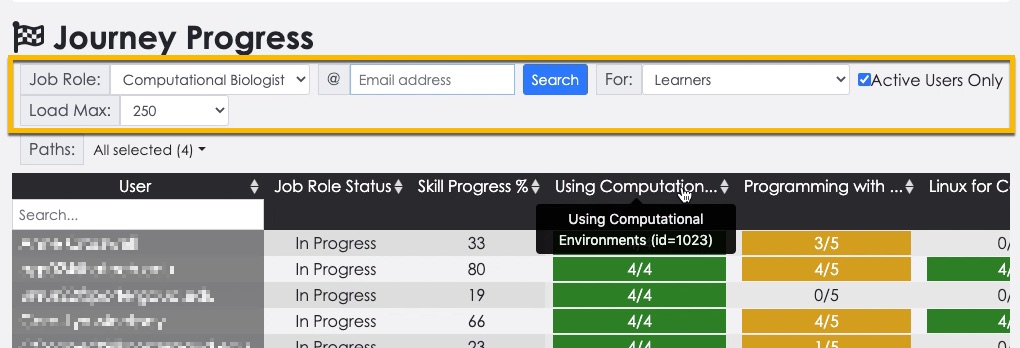
You can use the filters above the report to show specific learners or use the ‘Load Max’ filter to limit the number of learners shown on the screen at one time. De-select the ‘Active Users Only’ checkbox to show all learners in the course – not just those that have made some progress already.
Description
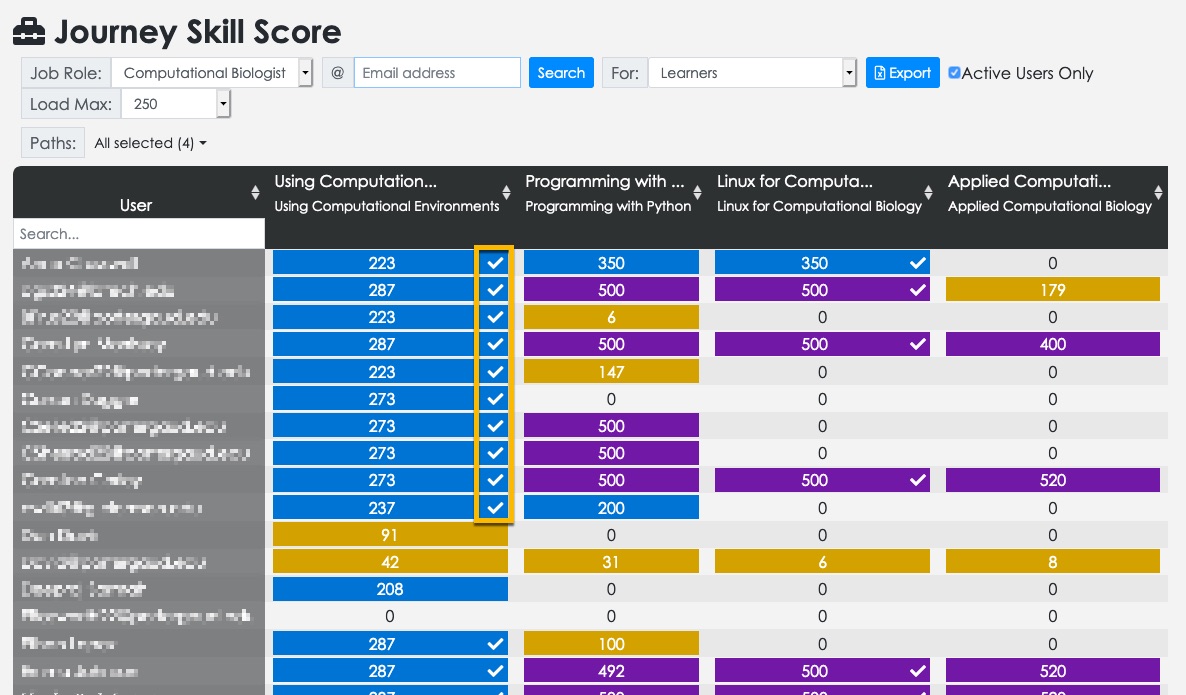
A couple of different reports provide additional insight on skill (lesson) scores and completion. The Journey Skill Scores report is a variation of the Journey Progress report that displays which learning paths (groups of skills) the learner has completed (noted by a checkmark), along with the “skill score” the learner achieved on average. The different colors represent various skill score ranges.
(NOTE: The skill score is not a grade, but a “gamification” metric that represents how many resources a learner completes and also how well they perform.)
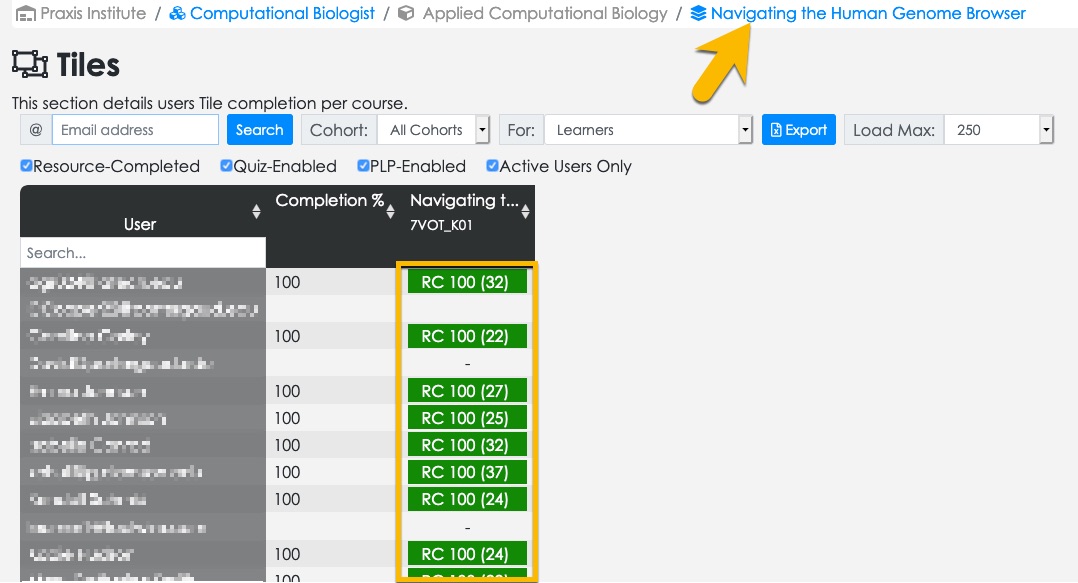
The Tiles report shows which learners have completed each lesson/skill. Click the breadcrumb at the top of the screen to see a report for a different skill. (NOTE: “Tiles” are the same as competencies in TILE.)
 (back to top)
Description
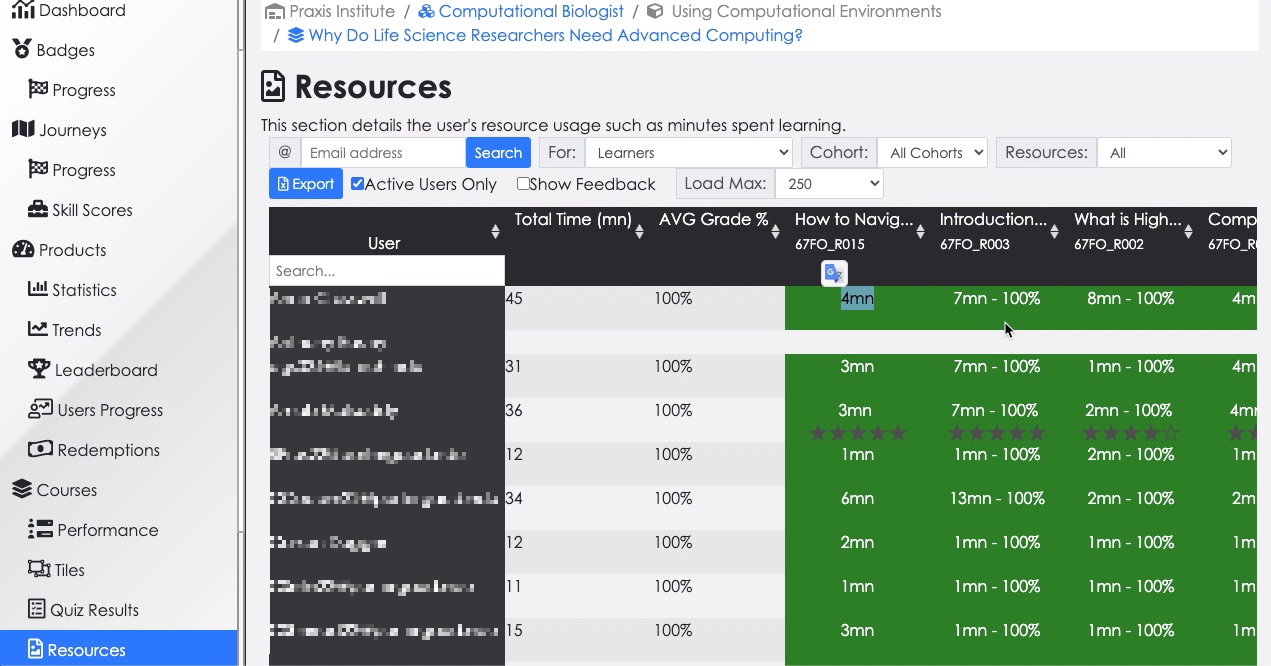
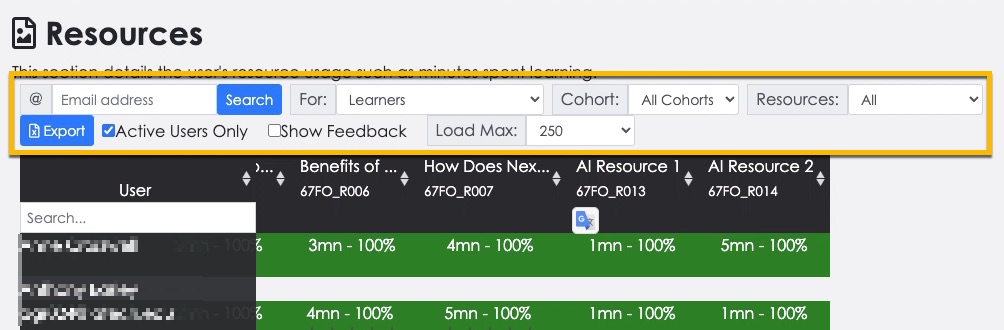
The Resource Usage report displays a detailed report of each learner’s resource usage and progress in each skill (lesson) of the course. This is the best report if you want a detailed view of how the learners are interacting with your content and activities.
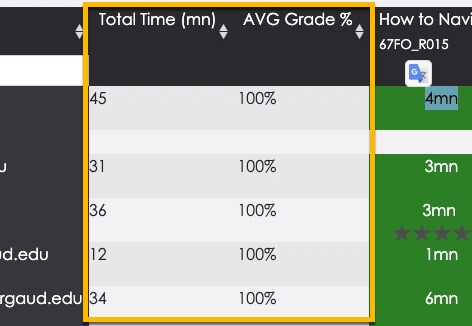
Time and GradeThese columns show the total time and average resource grade for each learner in the skill/lesson. Each column can be sorted in ascending or descending order.
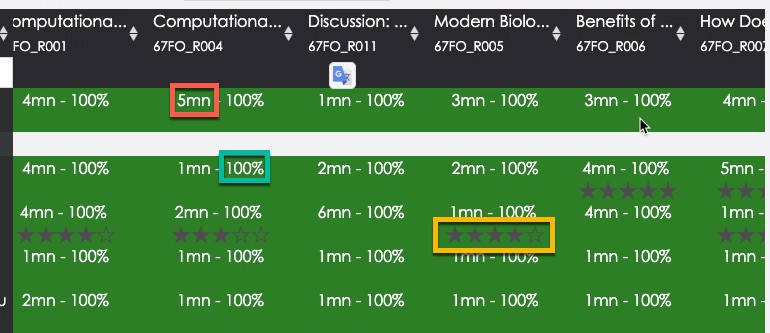
The key areas of this report are the resource columns. Each cell in a column can display three key metrics:
- Time the learner spent in the resource. Keep your eye on these durations to see if learners are spending more or less time than expected – this may indicate where learners are struggling (or where they are not doing the work they need to).
- Score/grade the learner achieved in the resource/activity. This will always be 100% for “complete when visited” resources. But any scored or “time on task” resource will show the actual percentage achieved. Obviously this can be a useful data point to check learner performance.
- The rating the learner gave to the resource. This learner feedback is optional for every resource and is given on a 5-star scale. This data can be helpful in identifying resources that are problematic for learners.
 Report Filters
You can use the filters above the report to show specific learners, cohorts, resource types, or use the ‘Load Max’ filter to limit the number of learners shown on the screen at one time. De-select the ‘Active Users Only’ checkbox to show all learners in the course – not just those that have made some progress. You can also select the “Show Feedback” checkbox at the top of the report if you want to view any comments that learners wrote about the resources.
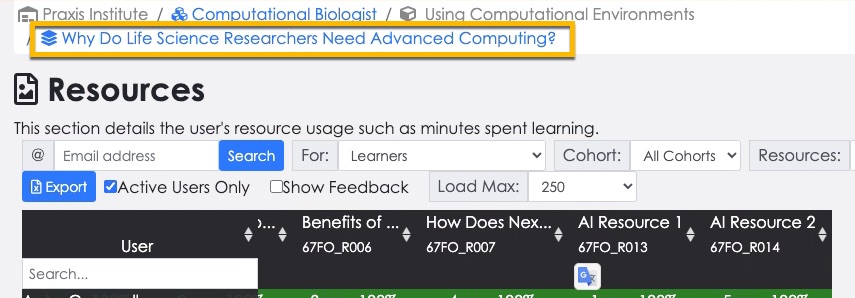
This report displays resource usage for one skill/lesson at a time. To change the skill, select the skill name in the breadcrumb above the report and then select the skill you want to view a report for.
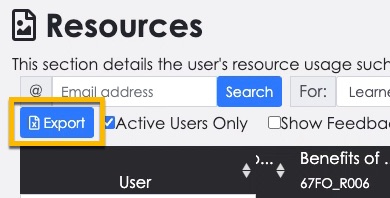
The data in this report can be exported to Excel format and downloaded. Just click the Export button at the top of the report and then follow the instructions to download the report.
This can be a useful tool when submitting grades to your LMS.
Description
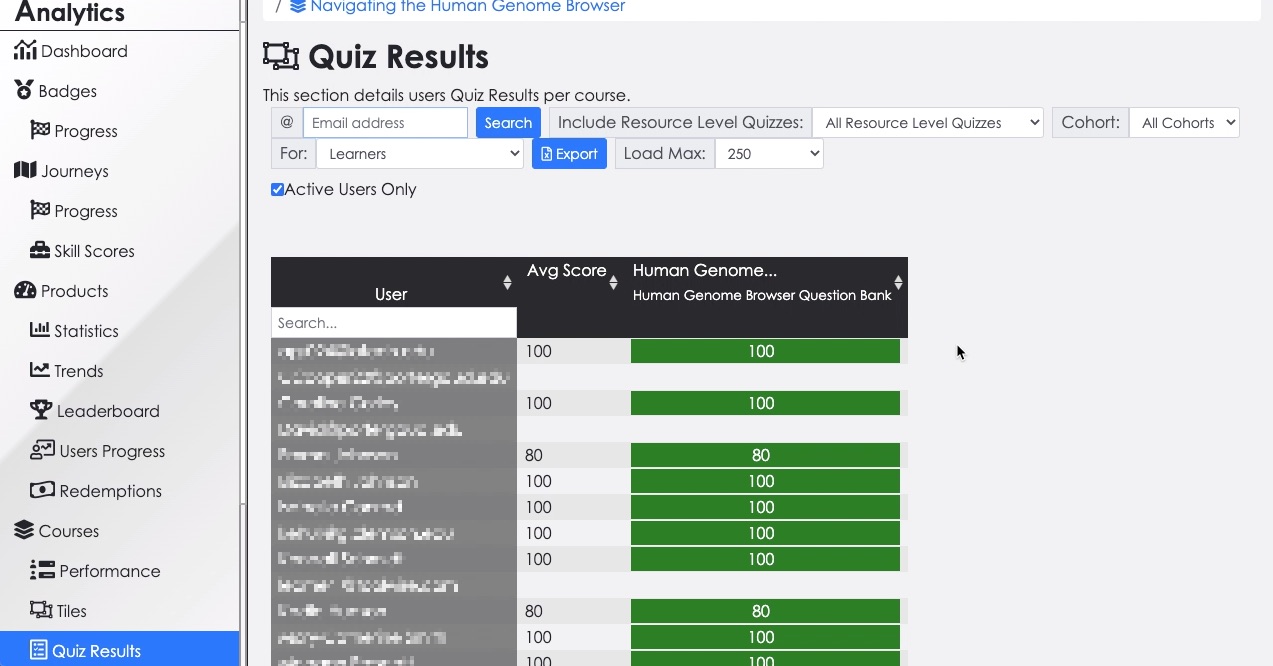
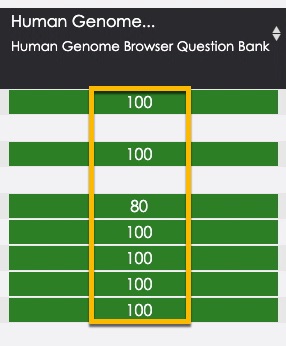
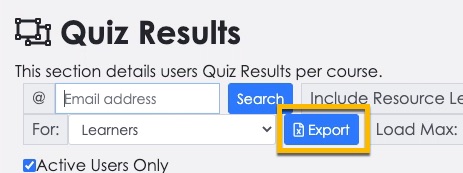
The Quiz Results report displays all the quiz scores for each learner in one skill (lesson) of the course. This is a useful report for checking learner comprehension skill-by-skill, and for exporting scores to be used for course grades.
Average Quiz ScoreThis column shows each learner’s average quiz score for the skill. (If there’s only one quiz in a skill, this number will be the same as the individual quiz score.)
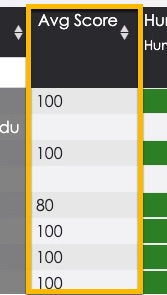
Each of the other columns in the report shows the percentage quiz score. Scores that resulted in a completed quiz are colored green.
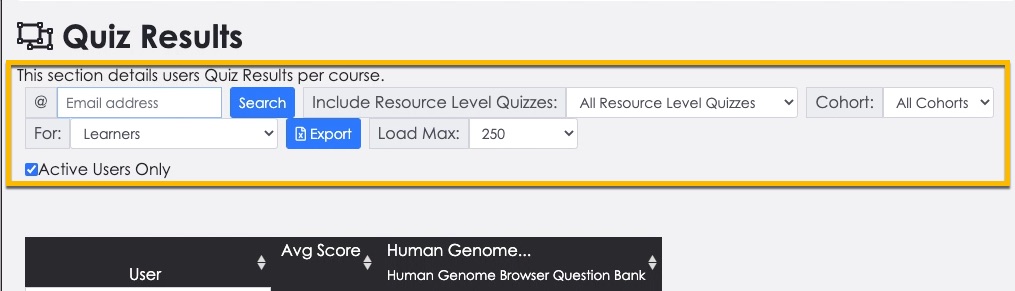
You can use the filters above the report to show specific learners and cohorts, or use the ‘Load Max’ filter to limit the number of learners shown on the screen at one time. De-select the ‘Active Users Only’ checkbox to show all learners in the course – not just those that have made some progress.
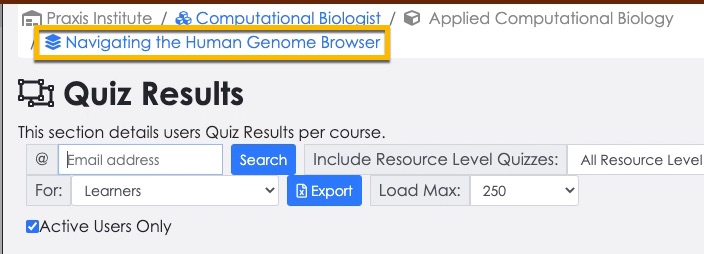
This report displays quiz results for one skill/lesson at a time. To change the skill, select the skill name in the breadcrumb above the report and then select the skill you want to view a report for.
The data in this report can be exported to Excel format and downloaded. Just click the Export button at the top of the report and then follow the instructions to download the report.
This can be a useful tool when submitting grades to your LMS.
Description
The Analytics Dashboard displays multiple “widgets” with high-level information about course usage, engagement, and performance. Here’s a breakdown of the report:
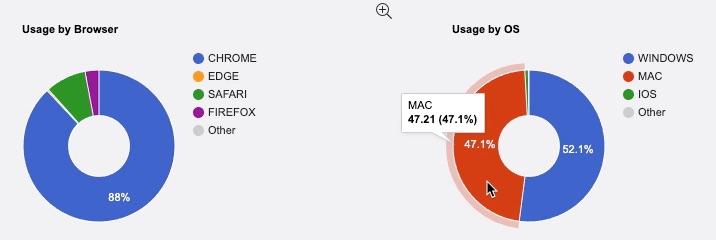
UsageThe usage widgets indicate the percentage of learners that are using certain browsers or operating systems. This may be helpful information if some learners are having trouble accessing or completing certain learning resources or activities.
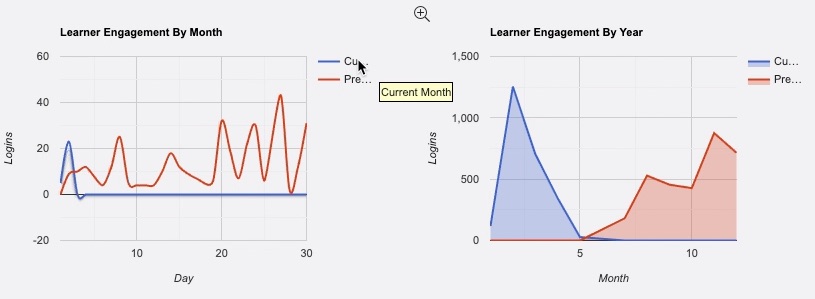
These widgets indicate the level of engagement, based on the number of logins, on a monthly and yearly basis. This can be useful for tracking learner activity in your course at a high level (especially the monthly widget).
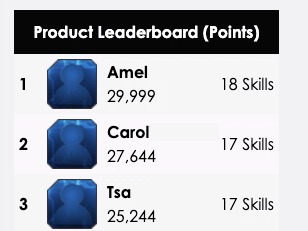
The leaderboard widget displays a list of the top performers in your class, based on the number of game points they have scored, and skills they’ve completed. (NOTE: we’ll cover game points in more detail in the next skill, “Scoring and Feedback.”)
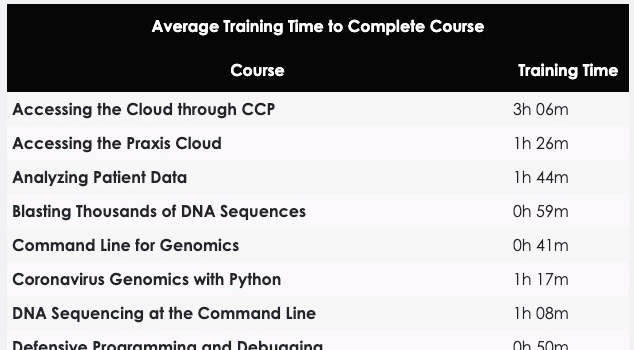
This widget displays the average time it takes your learners to complete each skill/lesson in your online course. This duration information could be useful for identifying topics that may be giving learners difficulty. (NOTE: the term “courses” has various meanings in TILE – here it means the same thing as a skill, or lesson.)
Description
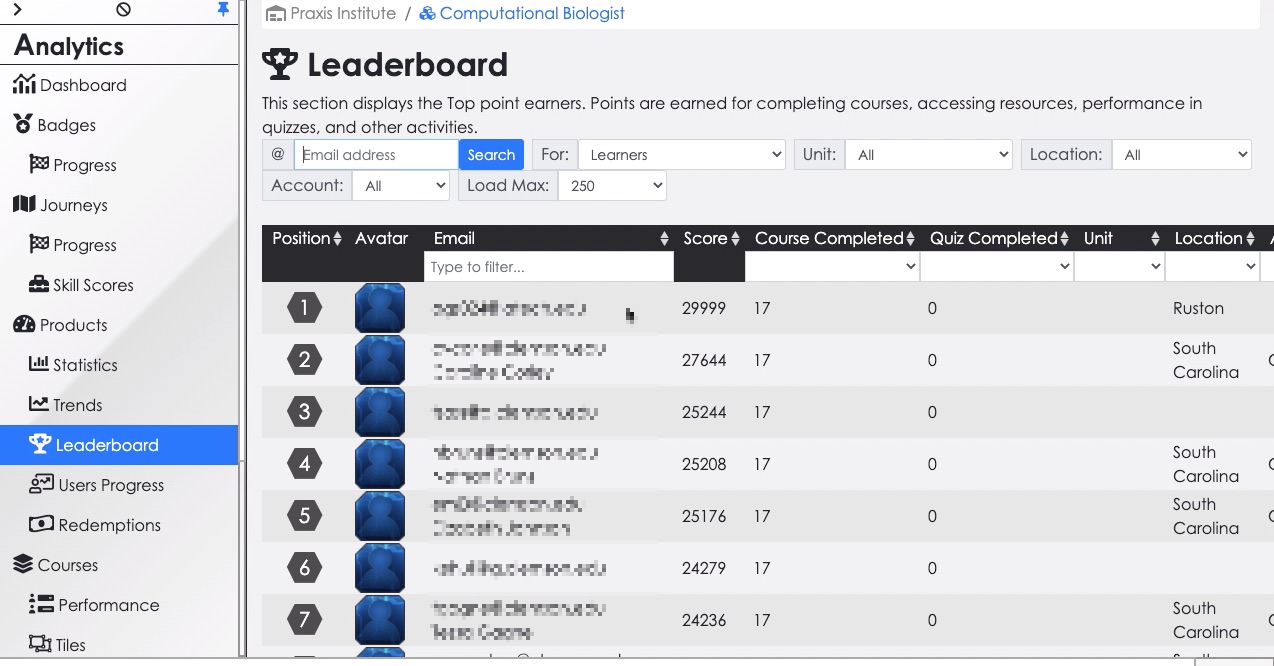
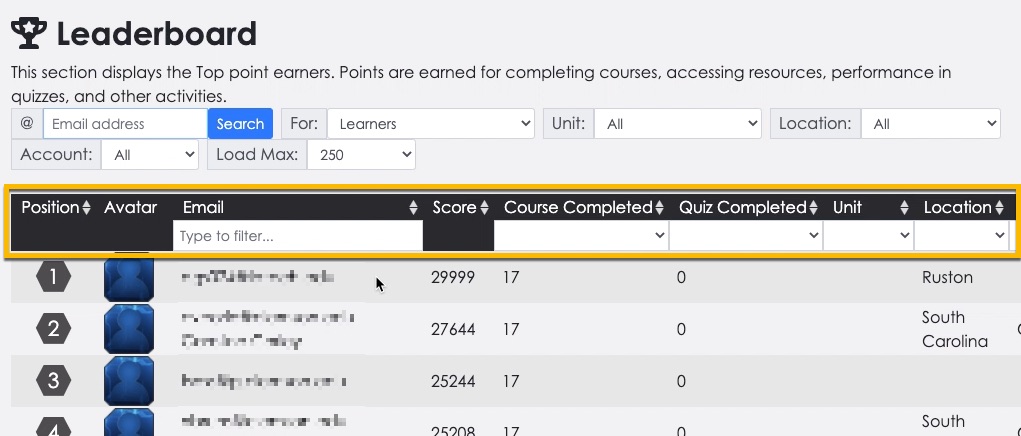
The Leaderboard displays more details on the learners that are scoring the most game points in the course, completing courses (skills), completing quizzes, etc. Aside from showing the top performers, this report can also be useful for identifying learners who are struggling.
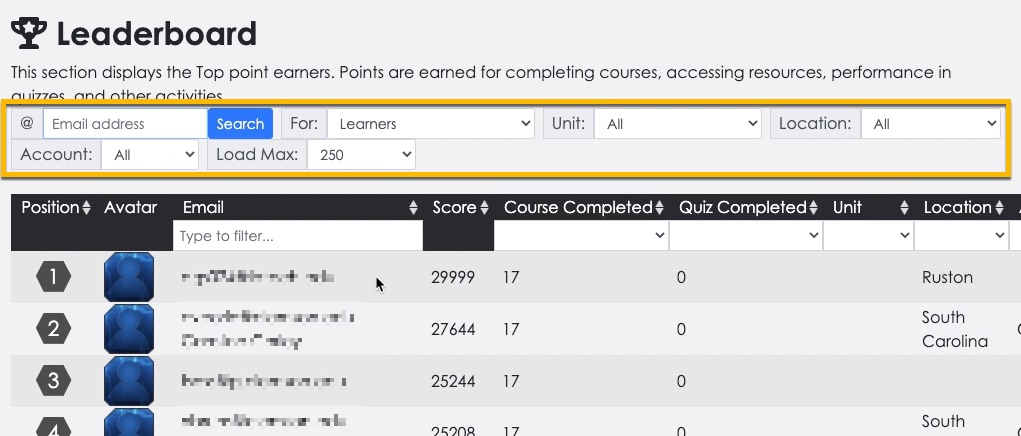
Report FiltersYou can use the filters above the report to show specific learners or use the ‘Load Max’ filter to limit the number of learners shown on the screen at one time.
Specific columns can also be filtered or sorted to your preference. For instance, you can change the sort for the ‘Position’ column to show the lowest performing learners at the top of the report.